Overview
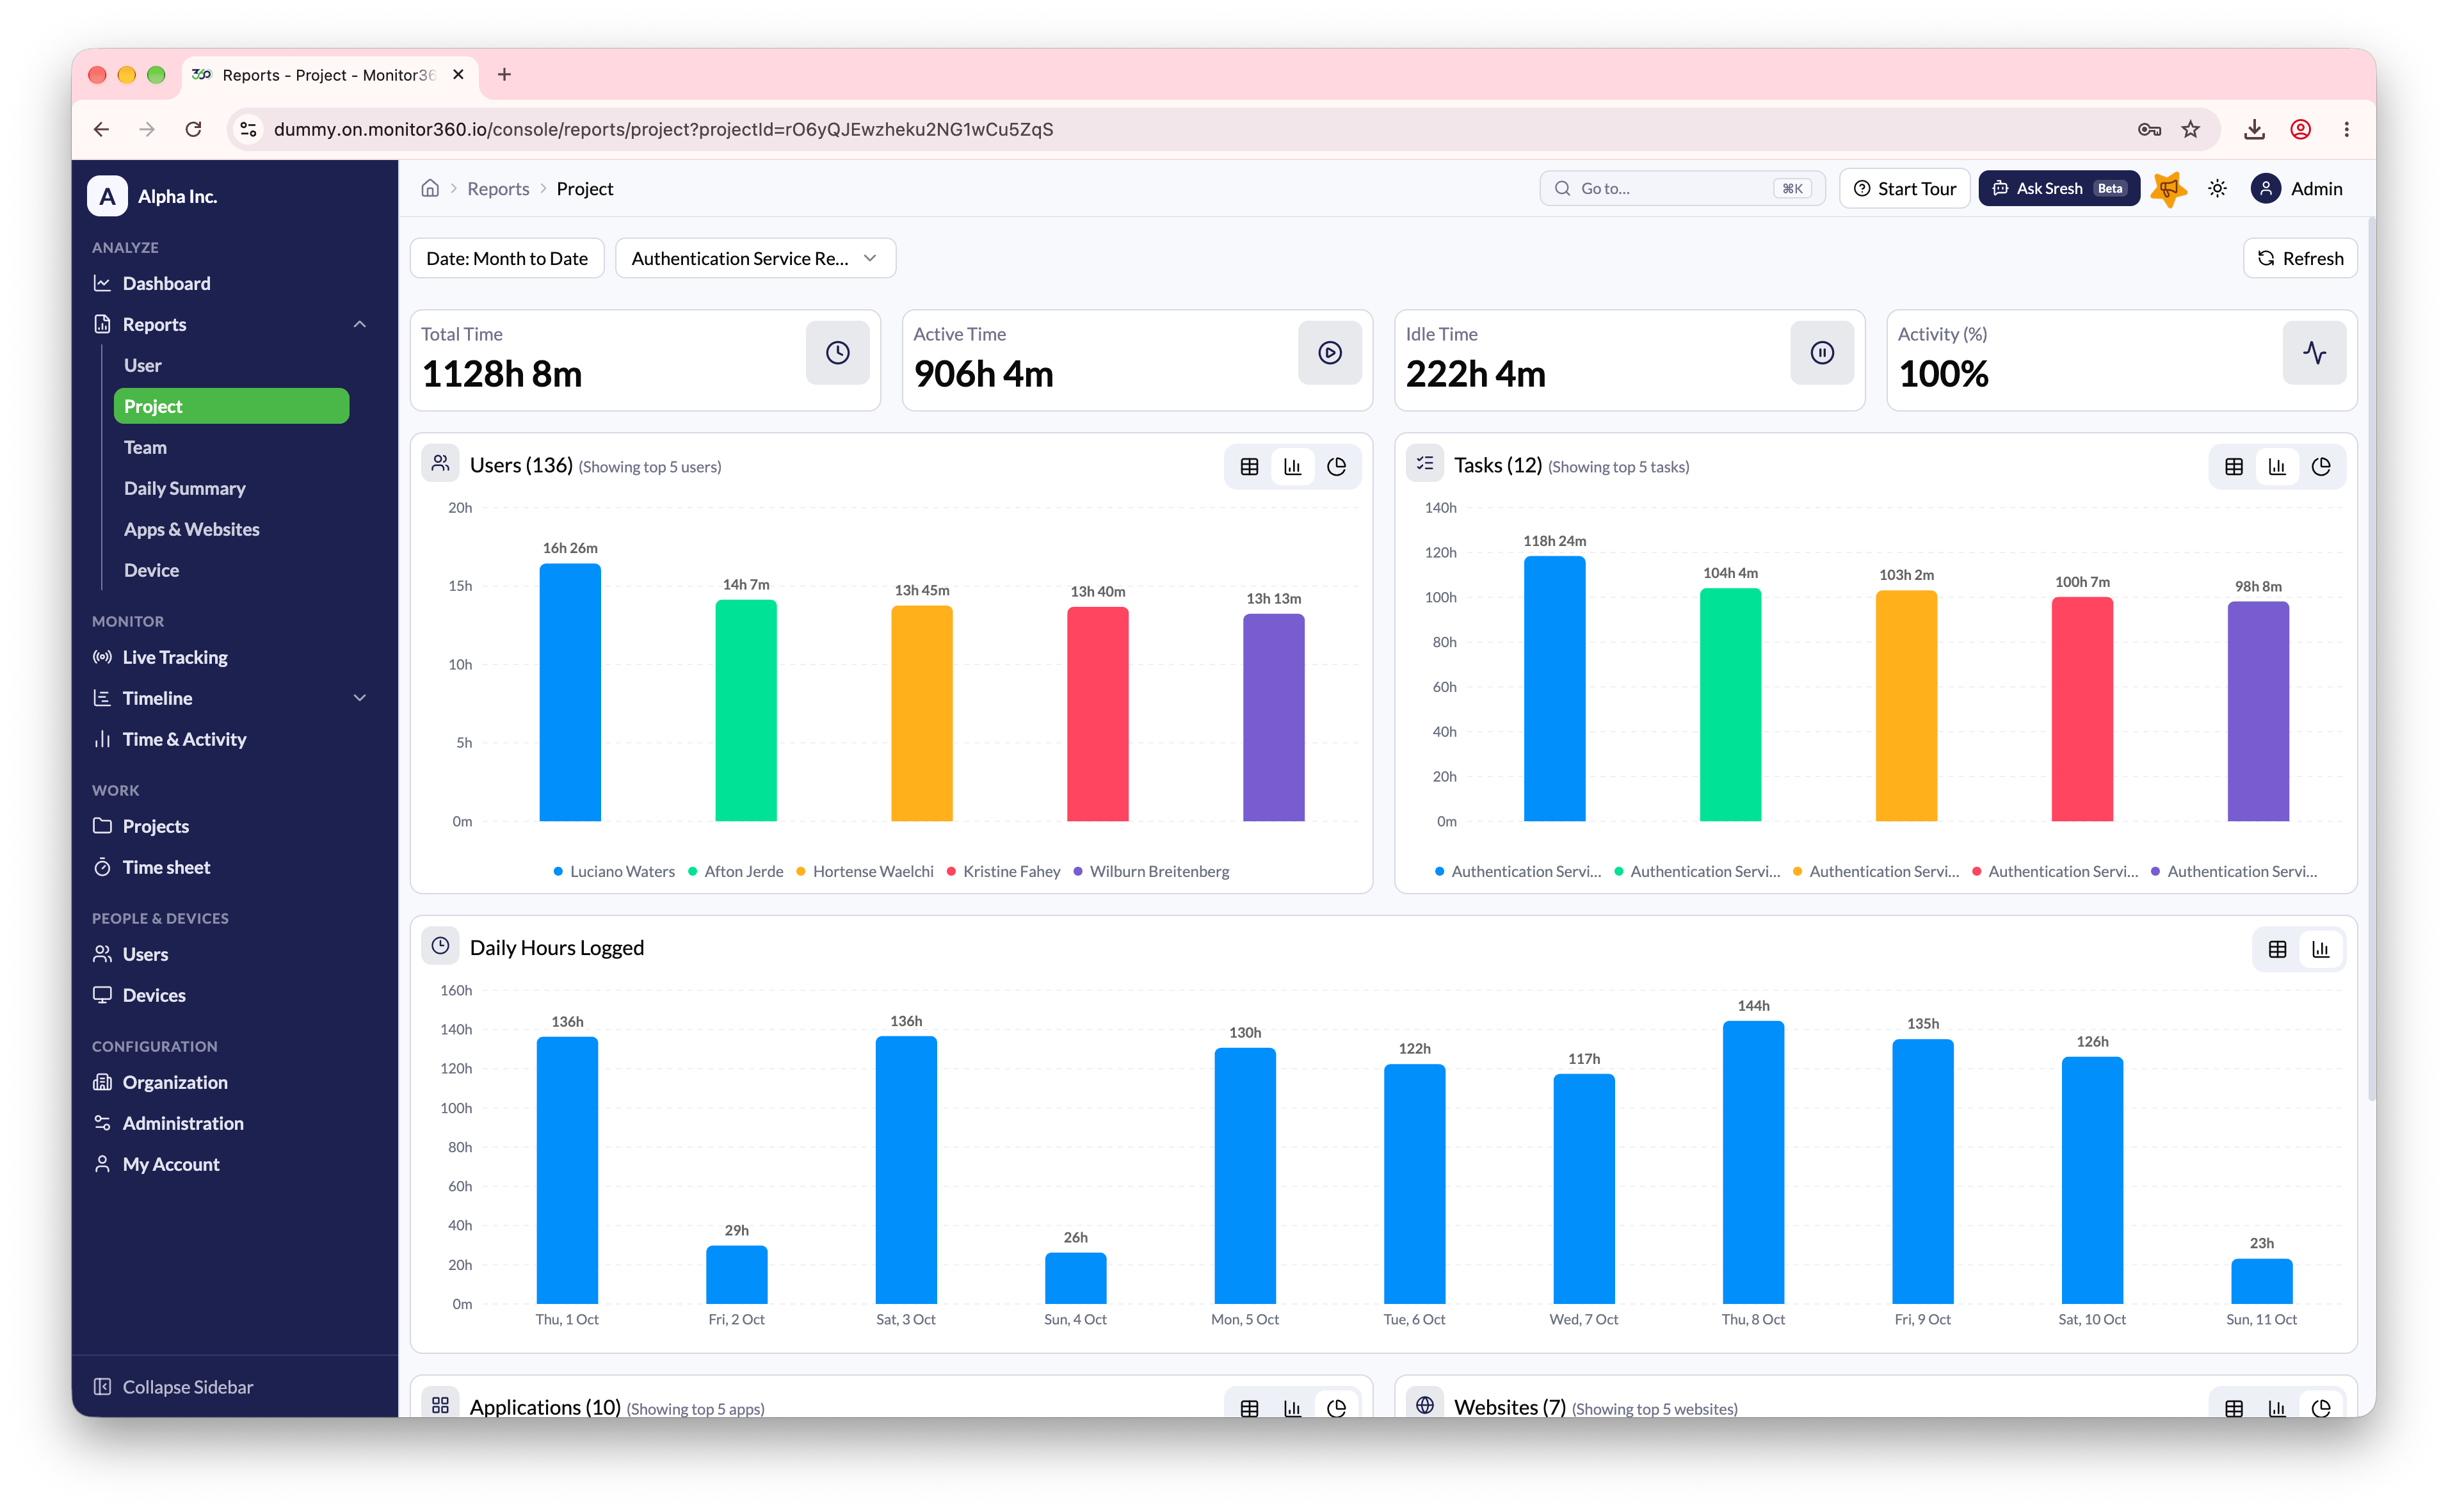
The Project Report provides a project-centric view of time tracking and productivity, with daily hours logged and aggregated across all users working on the selected project.1. Summary Metrics
These cards reflect totals for the selected project and date range:- Total Time - Total hours logged on the project
- Active Time - Total Time minus Idle Time
- Idle Time - Inactive time
- Activity % - How much of the active time on the project had keyboard or mouse input. See Metric Definitions
2. Users Section
- Displays users who logged time on the project
- Shows contribution per user
- Helps identify who worked on the project and how workload is distributed
3. Tasks Section
- Lists tasks linked to the project
- Shows time spent per task
- Useful for tracking task-level progress and identifying time-consuming activities
4. Daily Hours Logged
This section shows day-by-day total hours logged for the project, combining all contributors. Key benefits:- Tracks project velocity over time
- Identifies active vs inactive days
- Helps with sprint planning, client billing, and delivery forecasting
5. Applications & Websites Used
Applications Used- Shows applications used while working on the project
- Helps confirm productive tool usage
- Useful for compliance and audit purposes
- Displays websites accessed during project work
- Helps analyse browsing behaviour related to the project
- Supports productivity and security reviews